
An Essential Guide to Freon Pressure Charts and Correct Readings
Why Understanding Freon Pressure Charts is Critical for Equipment Reliability
A freon pressure chart shows the exact pressure-temperature relationship for different refrigerants, helping you diagnose cooling system problems before they become costly failures. Whether you're dealing with mortuary coolers, HVAC systems, or automotive A/C units, these charts are your roadmap to proper system operation.
Quick Reference for Common Refrigerants:
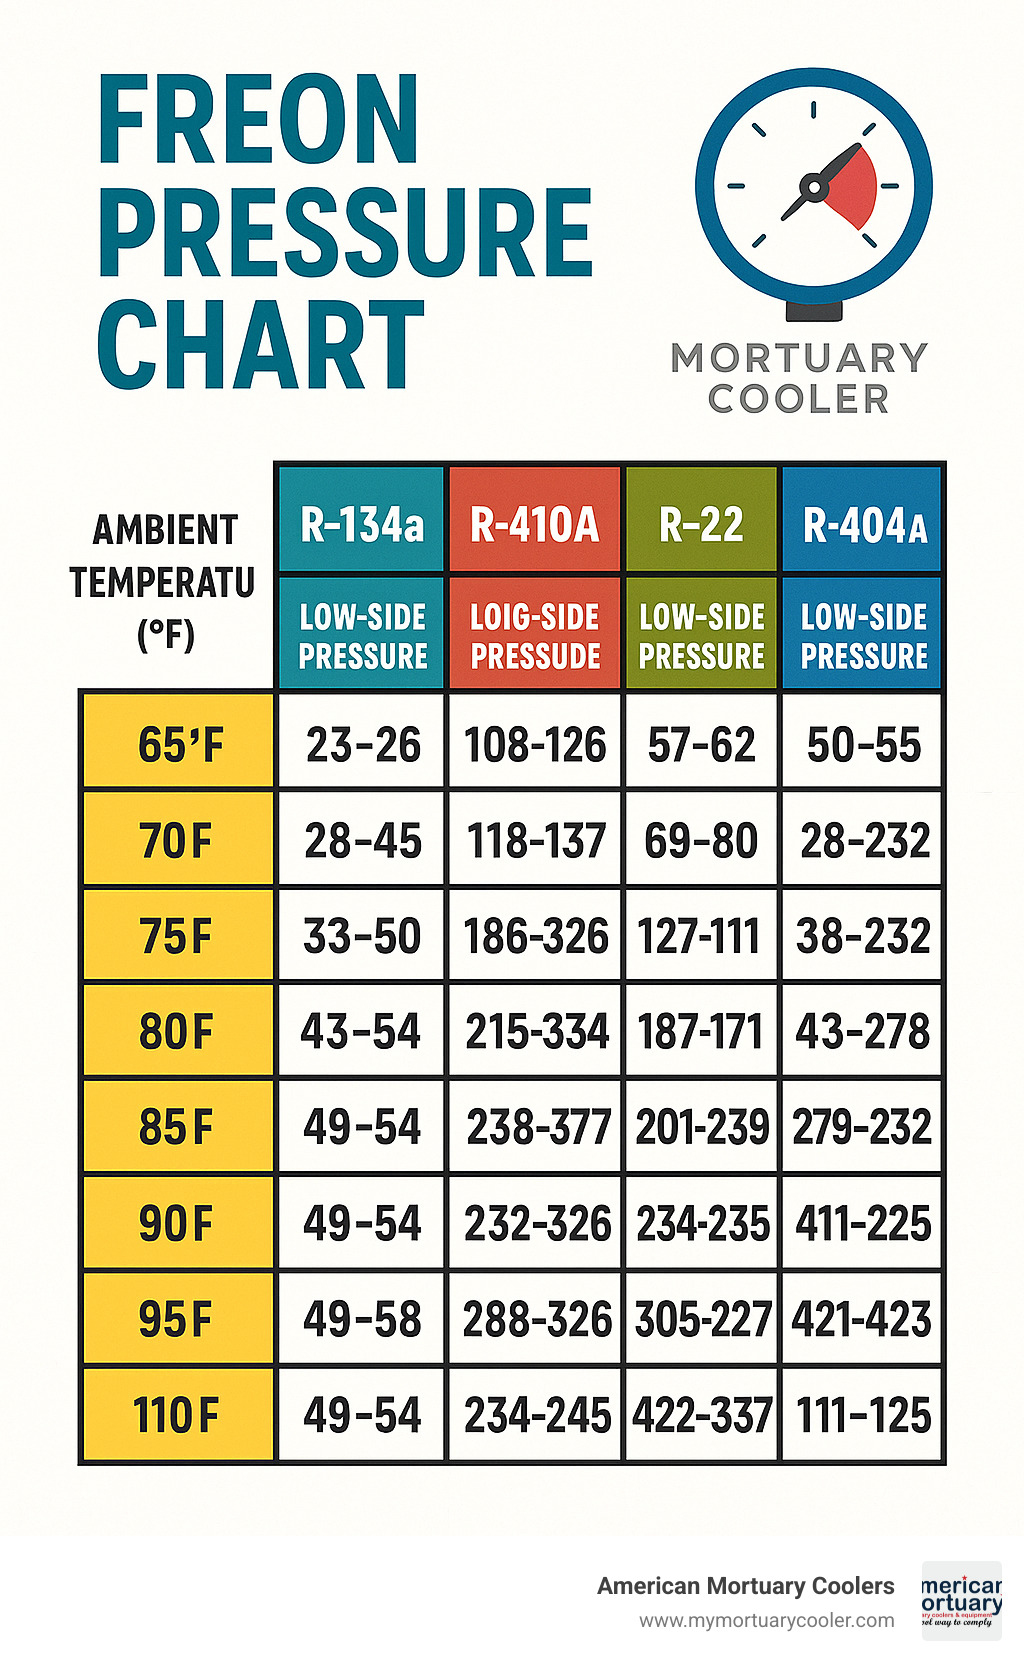
- R-134a at 75°F: Low-side 35-40 psi, High-side 150-170 psi
- R-410A at 75°F: Approximately 218 psig
- R-22 at 75°F: Approximately 132 psig
- R-404A at 75°F: Approximately 150 psig
Pressure-temperature charts work because refrigerants have a direct relationship between their temperature and pressure at saturation. When your system pressures don't match the chart values for your ambient temperature, it signals problems like low refrigerant charge, blocked expansion valves, or compressor issues.
These charts are especially important for funeral home directors who can't afford equipment downtime. A mortuary cooler failure during peak times can compromise your service quality and create serious operational challenges.
As Mortuary Cooler with years of experience in refrigeration systems, I've seen how understanding freon pressure charts can prevent emergency service calls and extend equipment life. My background in mortuary cooling systems has shown me that proper pressure diagnostics are essential for maintaining the reliable operation your facility depends on.
Glossary for freon pressure chart:
What Is a Freon Pressure-Temperature Chart?
Think of a freon pressure chart as your refrigerant's personal ID card - it tells you exactly what pressure and temperature combination your system should be running at. These charts are built around something called saturation, which is the sweet spot where your refrigerant can exist as both liquid and vapor at the same time.
Here's where it gets interesting: when refrigerant changes from liquid to vapor (or back again), it doesn't actually change temperature during the transition. Instead, it absorbs or releases what we call latent heat. This phase change is the heart of how your mortuary cooler keeps things cold.
The saturation point is where the refrigeration magic happens. At this exact temperature and pressure combo, your refrigerant is perfectly balanced between liquid and vapor states. Drop below this temperature, and you've got subcooled liquid. Go above it, and you're dealing with superheated vapor.
Now, if you're working with refrigerant blends like R-407C or R-404A, things get a bit more complex. These blends don't behave like single-component refrigerants - they have what's called temperature glide.
| Pressure Type | What It Means | When You Use It |
|---|---|---|
| Bubble Point | Pressure where the first vapor bubble forms in liquid | Calculating subcooling |
| Dew Point | Pressure where the first liquid drop forms in vapor | Calculating superheat |
| Temperature Glide | Difference between bubble and dew points | Affects charging and troubleshooting |
Here's a real-world example: R-407C has a temperature glide of about 7°F. This means it doesn't boil at just one temperature like pure refrigerants do. At 32°F, R-407C shows a liquid saturation pressure of 46.3 psig and vapor saturation pressure of 33.7 psig. That's why your pressure readings might seem off if you're not accounting for this glide.
Understanding these basics explains why your mortuary cooler might show different pressures than you'd expect. The entire refrigeration cycle depends on these phase changes to move heat from inside your cooler to the outside environment. When you grasp how bubble point and dew point work together, troubleshooting becomes much clearer.
More info about refrigeration basics can help you understand the complete picture of how these pressure-temperature relationships keep your equipment running smoothly.
How to Read and Use a Freon Pressure Chart
Getting comfortable with a freon pressure chart is like learning to read a roadmap for your cooling system. The good news? Once you understand the basics, these charts become incredibly straightforward diagnostic tools.
Your first step is getting the right equipment. Professional manifold gauges are your best friend here - they have separate hoses for the low-side (suction) and high-side (discharge) pressures. Many quality manifold gauges actually have PT charts printed right on the gauge faces, which saves you from juggling paperwork while working on equipment.
Setting up your gauges correctly makes all the difference. Connect your low-side gauge to the larger service port, usually found on the suction line. The high-side gauge connects to the smaller port on the liquid line. Here's a pro tip that'll save you headaches: always let the system sit for at least 15 minutes after shutdown before taking readings. This gives you accurate static pressures instead of misleading operating pressures.
Temperature compensation is where many technicians stumble, but it's actually pretty simple once you get the hang of it. Your system's pressures change dramatically with ambient temperature. Think of R-134a as an example - at a comfortable 65°F, you should see 25-35 psi on the low side and 135-155 psi on the high side. But when it's a sweltering 95°F outside, those same healthy readings jump to 50-55 psi low side and 275-300 psi high side.
Converting between pressure units becomes second nature with practice. To go from psi to kPa, multiply by 6.895. For psi to bar, multiply by 0.0689. Temperature conversions from Fahrenheit to Celsius follow the old formula: subtract 32, then multiply by 5/9.
Digital apps and online calculators can handle these conversions instantly, but understanding the relationships helps you catch obvious mistakes before they cause problems. The Refrigerants - Pressure vs. Temperature Charts provide comprehensive reference data when you need to look up specific refrigerant properties.
Interpreting a Freon Pressure Chart in HVAC Systems
HVAC systems present their own unique challenges when reading pressure charts. Most systems today use either R-22 (being phased out) or R-410A (the current standard). These refrigerants operate at completely different pressure ranges, which is why you can never mix them or use the wrong equipment.
At a standard 75°F ambient temperature, R-22 shows approximately 132 psig saturation pressure, while R-410A operates at roughly 218 psig. This pressure difference means R-410A systems need beefier components and different safety considerations.
Heat pumps add another layer of complexity because they reverse operation between heating and cooling modes. What's the high side in cooling becomes the low side in heating. This reversal means you absolutely need to know which mode the system is running when you take your readings, or your freon pressure chart readings won't make sense.
Superheat and subcooling measurements work together with your pressure chart readings to give you the complete picture. Superheat measures the temperature difference between your actual suction line temperature and the saturation temperature from your pressure reading. Most systems run best with 8-12°F of superheat, though you should always check manufacturer specs first.
Subcooling tells you how much your liquid refrigerant has cooled below its saturation temperature. You'll measure the liquid line temperature and compare it to the saturation temperature from your high-side pressure reading. Healthy subcooling typically runs 10-15°F.
Interpreting a Freon Pressure Chart in Automotive A/C

Automotive A/C systems follow different rules than building HVAC equipment. Most cars use either R-134a or the newer R-1234yf refrigerant, and these systems are much more sensitive to ambient temperature changes.
R-134a systems show a clear pattern that correlates directly with outside temperature. At 65°F, expect 35-40 psi on the low side and 150-170 psi on the high side. When it's 75°F outside, those numbers stay pretty close to the same range. But at 85°F, pressures jump to 45-55 psi low side and 225-250 psi high side. On really hot 95°F days, you'll see 50-55 psi low side and 275-300 psi high side.
R-1234yf operates at slightly different pressures and requires special handling. At 80°F ambient, healthy readings show 43-48 psi on the low side and 173-205 psi on the high side. These newer refrigerants have much lower global warming potential, but they need different recovery equipment and safety procedures.
The ambient temperature correlation is much more dramatic in automotive systems because the condenser sits right behind the front grille, exposed to outside air and engine heat. Unlike mortuary coolers or building HVAC systems that might have indoor condensers, car A/C systems must reject heat directly to whatever temperature it is outside. This makes your freon pressure chart readings much more dependent on weather conditions and proper airflow through the condenser.
Common Refrigerant Pressure Ranges & Ambient Effects
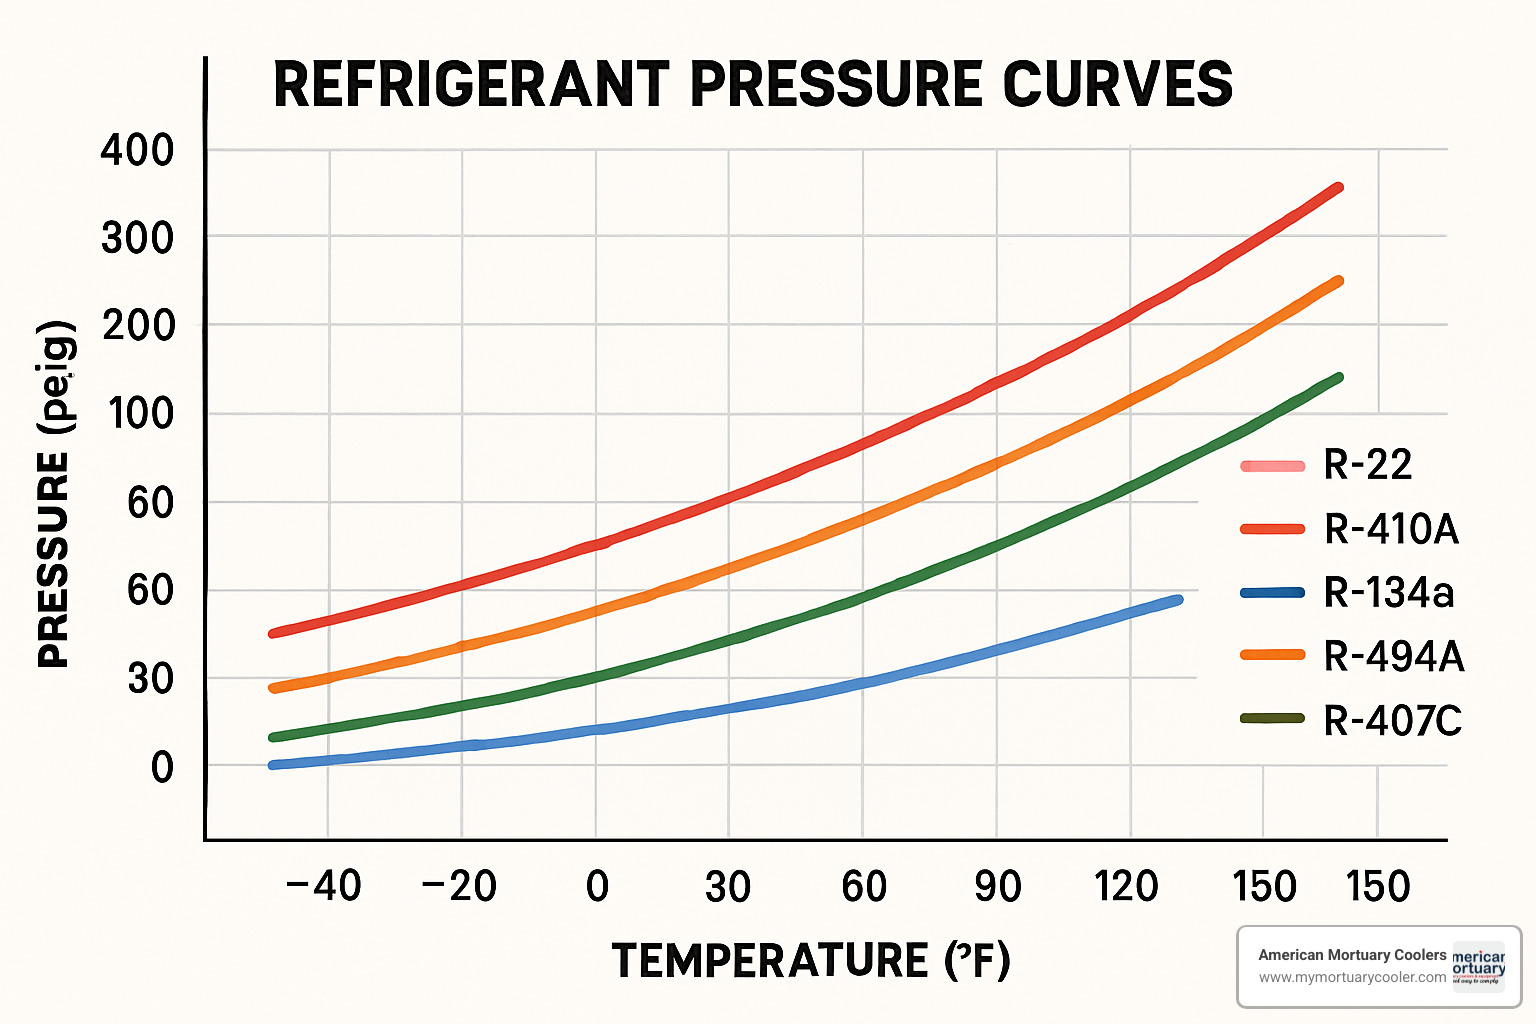
Every refrigerant has its own personality when it comes to pressure-temperature relationships. Understanding these differences helps you choose the right freon pressure chart and avoid costly diagnostic mistakes. Think of it like knowing different languages - each refrigerant speaks its own pressure dialect.
R-22 is the old workhorse that's being phased out due to ozone concerns. At 32°F, it runs at 27.8 psig, climbing to 195.9 psig at 100°F and reaching 381.7 psig at 150°F. If you're still working with R-22 systems, time is running out for affordable service.
The current champion is R-410A, also called Puron. This refrigerant runs much hotter than R-22 - at 75°F, you'll see 218 psig compared to R-22's 132 psig at the same temperature. By 100°F, R-410A jumps to 318 psig. These higher pressures mean you need special equipment rated for the increased stress.
R-134a is the automotive favorite that also shows up in some commercial applications. It's more gentle on pressures, running 27.8 psig at 32°F and 124 psig at 100°F. At 150°F, it matches R-22 at 381.7 psig.
Commercial refrigeration often uses R-404A, especially for medium and low-temperature applications. This zeotropic blend shows its personality through glide - at 32°F, you'll see 73.8 psig for liquid and 72.4 psig for vapor. By 100°F, it reaches 237 psig.
R-407C is another blend with attitude. At 32°F, it shows 46.3 psig on the liquid side but only 33.7 psig on the vapor side. This 7°F temperature glide means you need to pay attention to whether you're measuring bubble point or dew point pressures.
Here's where things get interesting - ambient temperature changes everything. A hot summer day can completely throw off your readings if you don't compensate. A 10°F jump in outside temperature can push your system pressures up 20-30 psi or more. This is why experienced technicians always check the thermometer before making diagnoses.
Altitude plays a smaller but still important role. Every 1,000 feet of elevation drops atmospheric pressure by about 0.5 psi. Your gauges will read slightly higher in Denver than in Miami, but the effect is usually small enough to ignore for most diagnostic work.
The key is matching your expectations to reality. When your mortuary cooler pressures don't line up with the chart, temperature compensation is usually the first thing to check. A system that looks broken might just be responding normally to a hot Tennessee summer day.
For detailed reference tables covering all these refrigerants and more, check out these Free Refrigerant Pressure Temperature Charts that provide comprehensive data for professional diagnostics.
Diagnosing System Issues & Safety Considerations

When your freon pressure chart readings don't match what you expect, the system is telling you a story. Learning to read these pressure patterns can save you hours of troubleshooting and prevent costly misdiagnosis.
Low readings on both gauges usually means you're dealing with a refrigerant leak. Before adding refrigerant, find and fix that leak first. Sometimes you'll see this pattern with a clogged liquid line filter or a stuck expansion valve, but low charge is the most common culprit.
Low side low, high side high typically points to a restriction somewhere in the system. Your expansion valve might be stuck, or there's a blockage in the orifice tube. You'll often see ice forming on the evaporator when this happens. This one usually needs professional attention to clear the blockage properly.
Low side high, high side low is the classic sign of compressor trouble. The compressor is running but not actually compressing much refrigerant. Internal valves might be leaking, or the compressor is just worn out. Either way, you're looking at little to no cooling despite the compressor humming along.
High readings on both sides means either too much refrigerant or poor heat rejection at the condenser. If it's overcharged, you'll need to recover some refrigerant (never vent it to atmosphere - that's illegal). Sometimes it's just a dirty condenser coil or a failed condenser fan.
Safety comes first when working with refrigeration systems. Safety glasses protect your eyes from refrigerant spray, which can cause frostbite instantly. Insulated gloves are essential when handling any system components. Long sleeves prevent skin contact with refrigerant, and proper ventilation keeps you from breathing concentrated vapors.
The EPA takes refrigerant handling seriously. All refrigerant must be properly recovered using certified equipment - no exceptions. This applies whether you're working with old R-22 systems or newer R-410A units. Venting refrigerant carries hefty fines and environmental consequences.
A2L refrigerants like R-1234yf add another layer of safety considerations. These are mildly flammable, so no smoking, welding, or open flames anywhere near the work area. Make sure you have proper ventilation and the right leak detection equipment that can handle these newer refrigerants.
For mortuary coolers specifically, you need to think about emergency procedures. Your facility can't afford downtime during peak periods, so understanding how to safely shut down systems and when to call for professional help is crucial. Keep proper documentation for EPA compliance, and establish a regular leak detection program.
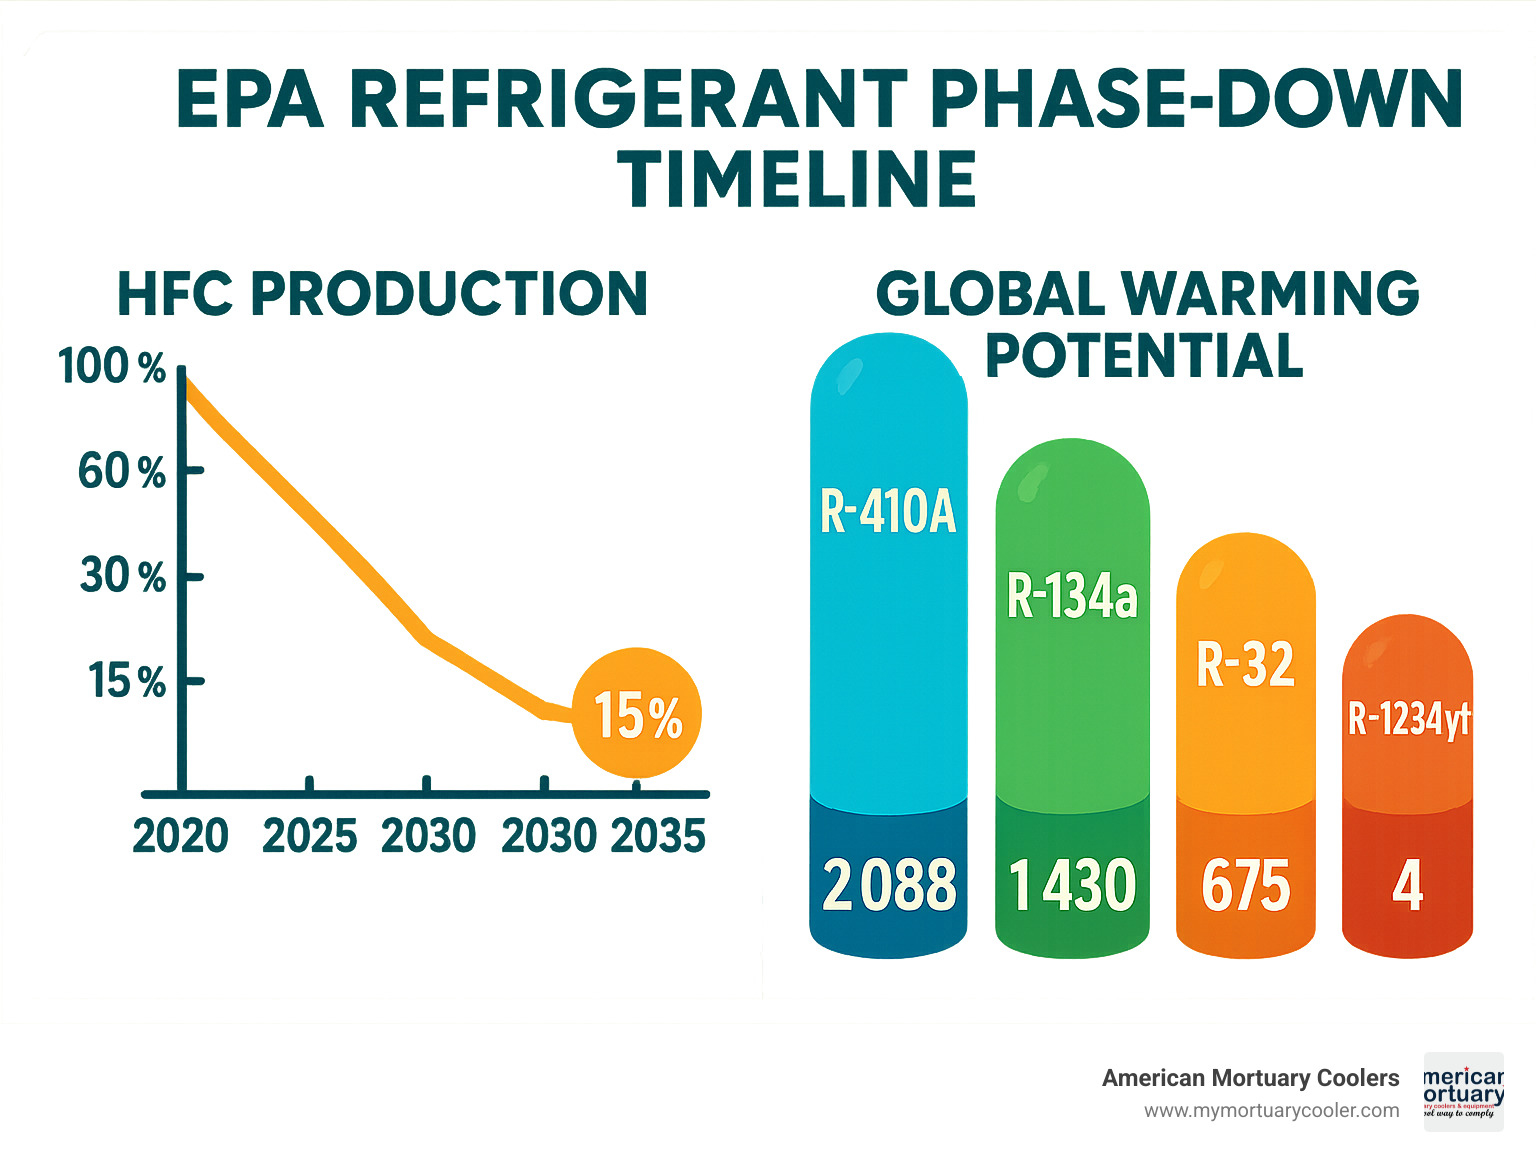
The refrigerant landscape is changing fast. The EPA's AIM Act is phasing down HFC production starting in 2025, with dramatic cuts planned through 2036. Understanding these newer, lower global warming potential refrigerants will become essential for anyone working in refrigeration. More info about iced evaporator fixes can help you troubleshoot common cooling problems before they become emergencies.
Frequently Asked Questions about Freon Pressure Charts
Let's tackle the most common questions I get about freon pressure charts. These are the real-world scenarios that come up when you're standing in front of a system that's not behaving the way it should.
What pressures should R-134a read at 75°F?
When you're working with R-134a at a comfortable 75°F, your gauges should tell a pretty straightforward story. The low-side pressure should sit comfortably between 35-40 psi (that's 241-276 kPa if you're working with metric units). Your high-side pressure should read 150-170 psi (1034-1172 kPa).
Here's the thing though - these numbers assume your system has been running for at least 15 minutes and the temperature isn't bouncing around. If you just fired up the system, give it time to settle. Automotive systems might show slightly different readings than a stationary unit because of design differences, but they should be in the same ballpark.
If your readings are way off from these ranges, don't panic. Go back to those diagnostic patterns we covered earlier - they'll help you figure out what's actually going on.
Can a freon pressure chart diagnose a bad compressor?
Absolutely! A freon pressure chart is like having a conversation with your compressor - it'll tell you when something's not right. The dead giveaway for compressor problems is what we call the high/low pattern. This is when your low-side pressure is running higher than normal while your high-side pressure is sitting lower than it should be.
What's happening here is your compressor isn't creating enough pressure difference between the suction and discharge sides. Think of it like a tired heart - it's working, but not pumping with the strength it used to. Internal wear, valve problems, or other mechanical issues can cause this pattern.
But here's where experience matters - don't jump straight to "bad compressor" without checking other possibilities first. An overcharged system, a restriction somewhere in the high-side, or even non-condensable gases can create similar symptoms. Always verify with additional tests like amp draw measurements and temperature readings across the compressor before making the final call.
How do I convert psi to bar on a freon pressure chart?
Converting between pressure units is simpler than it looks once you know the magic numbers. For psi to bar, multiply by 0.0689 (since 1 psi equals 0.0689 bar). Going the other way, bar to psi means multiplying by 14.504.
Let me give you a couple of real examples. Say you've got 150 psi on your gauge - that converts to 10.34 bar (150 × 0.0689). Or if you're looking at a European spec sheet showing 10 bar, that's 145.04 psi (10 × 14.504).
Honestly though, most modern digital manifold gauges will show you both units at once, which saves you from doing math in the field. And there are plenty of smartphone apps and online calculators that handle these conversions instantly. The conversion factor of 1 psi = 0.0689 bar is worth memorizing though - it'll help you catch obvious errors and stay sharp when the digital tools aren't handy.
Conclusion
Mastering freon pressure charts isn't just about reading numbers on a gauge - it's about understanding the heartbeat of your refrigeration system. These charts give you the power to spot problems before they turn into expensive emergencies, especially critical when you're responsible for mortuary cooling equipment that simply cannot fail.
Think of pressure charts as your refrigeration crystal ball. Pressure-temperature relationships are absolute for each refrigerant type, meaning R-134a will always behave the same way at 75°F, whether it's in your mortuary cooler or an automotive system. This predictability is what makes these charts so valuable for troubleshooting.
Ambient conditions dramatically affect your readings, so always factor in the room temperature when interpreting your gauge pressures. A system that looks "broken" at 95°F might be running perfectly normal - the pressures just reflect the hotter conditions.
The four basic abnormal pressure patterns tell specific stories about what's happening inside your system. Low/low usually means you're low on refrigerant. High/low often points to compressor trouble. Learning these patterns saves you diagnostic time and helps you communicate more effectively with service technicians.
Safety and environmental compliance aren't optional in today's regulatory environment. The EPA takes refrigerant handling seriously, and proper recovery procedures protect both the environment and your business from hefty fines. Always wear appropriate PPE and never vent refrigerant to atmosphere.
Different applications require different approaches. Your mortuary cooler operates differently than a residential heat pump or car A/C system, even though they all use similar refrigeration principles.
Here at American Mortuary Coolers, we've built our reputation on understanding that your cooling equipment isn't just machinery - it's essential infrastructure that families depend on during their most difficult moments. Our custom mortuary coolers are engineered with robust refrigeration systems that respond predictably when you apply proper diagnostic techniques.
Whether you're managing funeral operations in Johnson City, TN, or anywhere across our service area spanning from Atlanta to Los Angeles, understanding pressure charts helps you maintain the reliable performance your families deserve. Our direct delivery service across the contiguous 48 states means you get quality equipment backed by the knowledge to keep it running properly.
The refrigeration industry keeps evolving with new refrigerants and regulations, but the fundamental principles remain the same. Staying current with pressure chart interpretation protects your equipment investment and ensures uninterrupted service. More info about walk-in cooler design can help you optimize your entire cooling system for maximum efficiency.
When you're unsure about a diagnosis, don't hesitate to consult qualified HVAC professionals who understand both the technical requirements and regulatory landscape. Proper system maintenance today prevents costly emergencies tomorrow - and in the funeral industry, preventing emergencies isn't just about money, it's about maintaining the trust families place in your care.


